
live better, longer
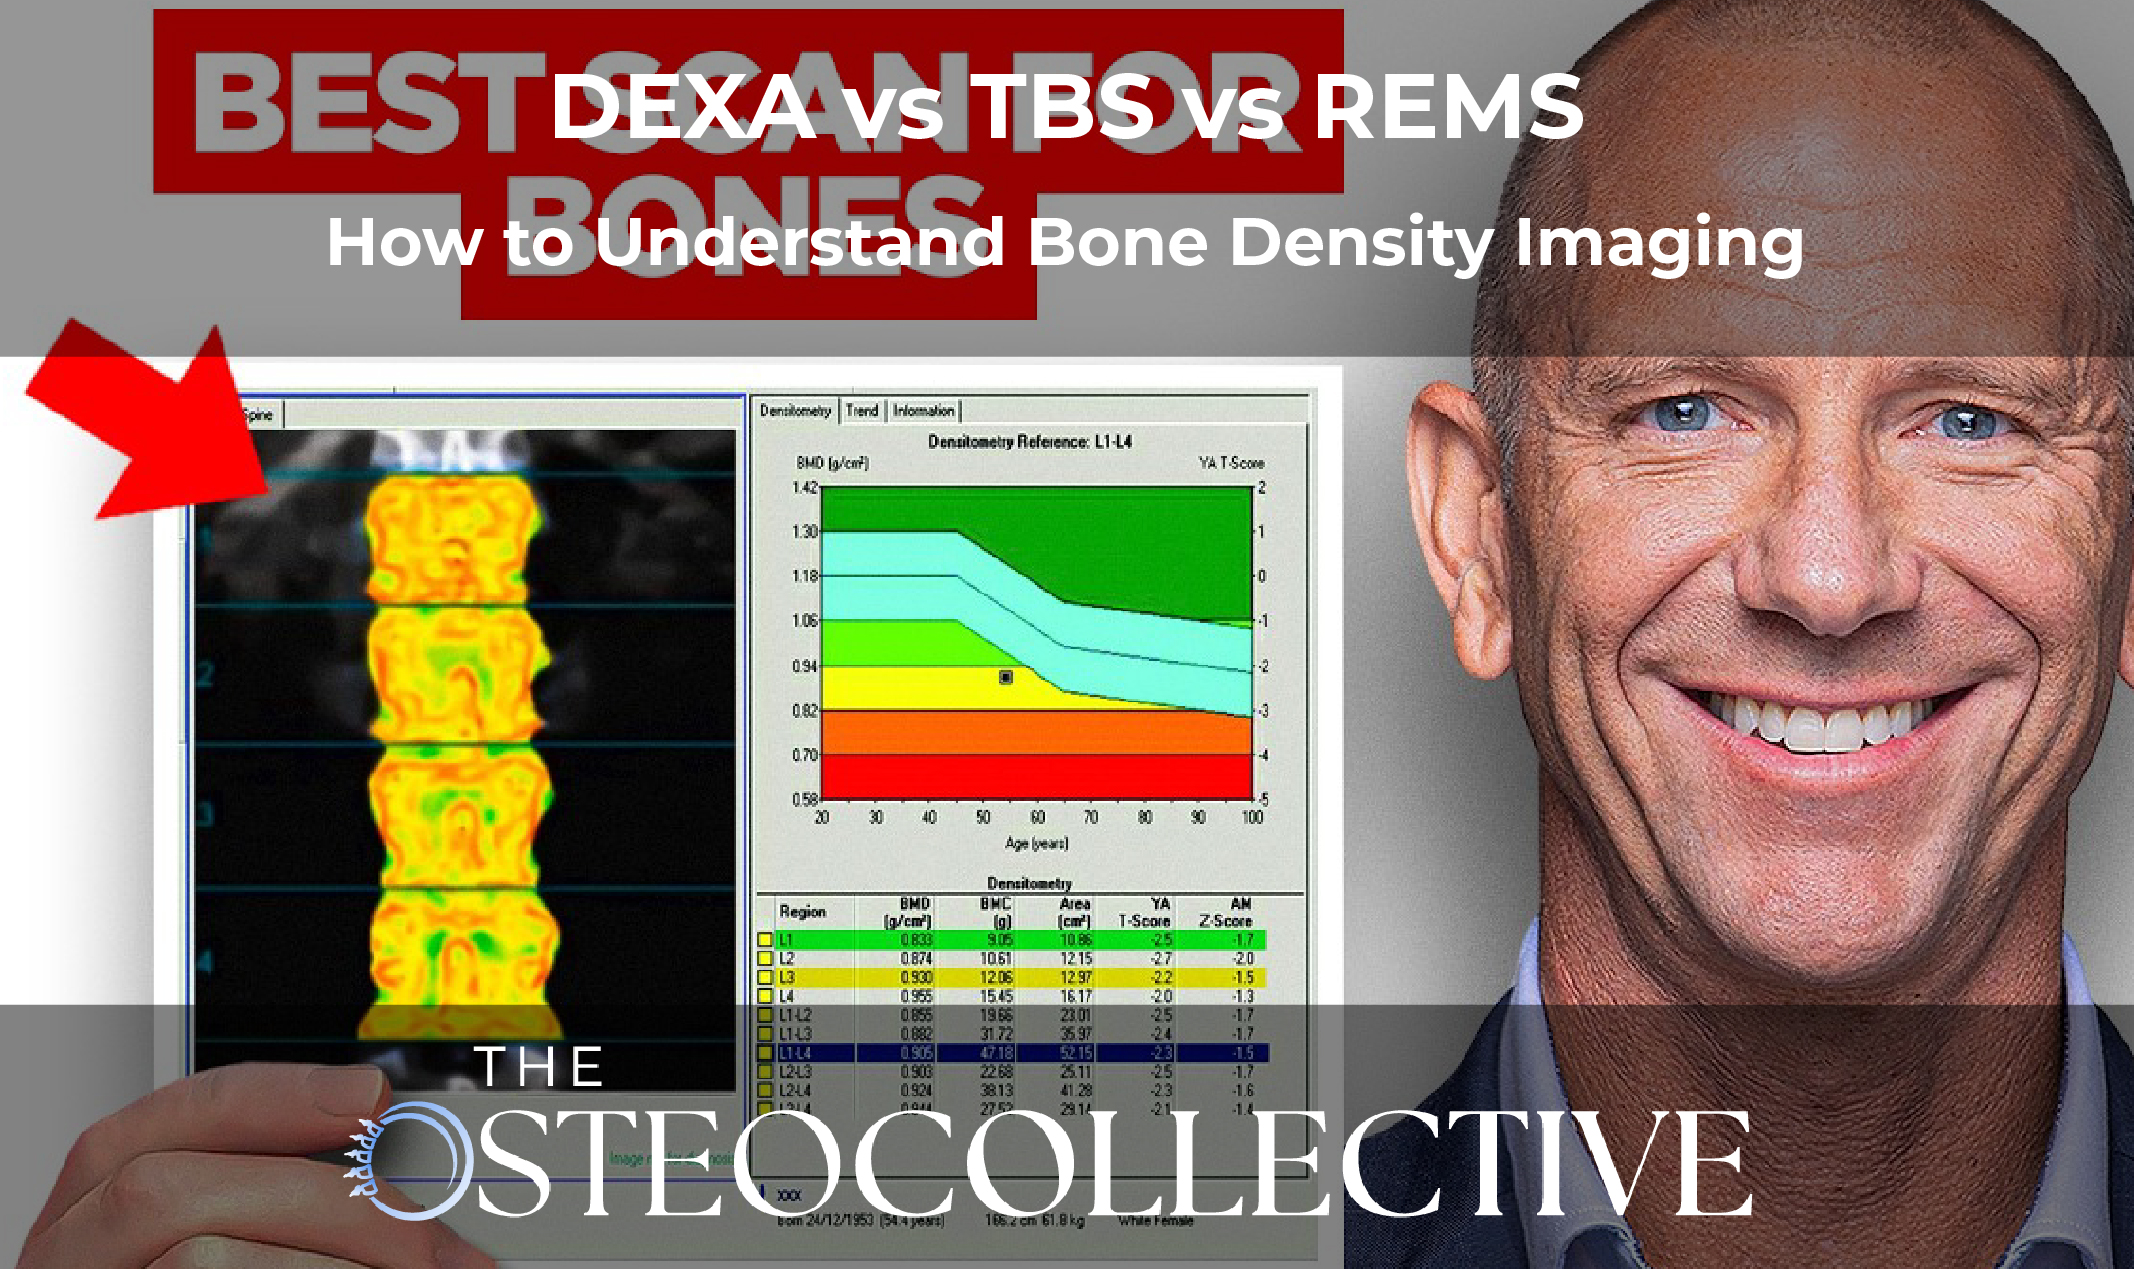
If you have osteoporosis or low bone density, you have probably heard of a DEXA scan.
You may have also heard of TBS, which stands for trabecular bone score. And more recently, you may have heard about REMS, an ultrasound-based technology that measures bone density and fracture risk in a different way.
That can get confusing fast.
Which test matters most?
What does a T-score actually mean?
What is a Z-score?
Can you compare a DEXA to a REMS?
Does TBS change your treatment plan?
And how do you know if your bones are actually getting better?
These are important questions because imaging is one of the main ways we monitor bone health. But imaging also has limitations. If you do not understand those limitations, it is easy to panic over small changes, misread your report, or think you improved when you may simply be looking at a different machine or different technology.
So let’s walk through the basics of DEXA, TBS, and REMS, and how each one can fit into a smarter bone health plan.
Bone health is not just about whether you have osteoporosis or not.
The real goal is to understand your fracture risk and whether your plan is working.
Imaging can help us measure:
But no imaging test is perfect.
DEXA gives us useful information, but it has limitations. TBS can add insight into bone quality, but it does not always change what we do. REMS may provide additional information about density and fragility, but it is still less widely available than DEXA.
The best approach is to understand what each tool can and cannot tell you.
DEXA stands for dual-energy X-ray absorptiometry.
It is the most common imaging test used to diagnose osteoporosis and osteopenia. It uses low-dose X-ray technology to estimate bone mineral density.
A standard DEXA report usually includes measurements from the:
For most people, the spine and hip are the most important areas to review.
A DEXA report usually includes three important numbers:
Let’s break those down.
Bone mineral density, or BMD, is usually reported in grams per centimeter squared.
This is the actual density measurement from the scan.
If you are comparing one DEXA to another over time, bone mineral density is one of the most important numbers to review.
Many people focus only on the T-score, but the BMD value gives a more direct view of what changed.
The T-score compares your bone density to the average peak bone density of a healthy young adult of the same sex.
This is the number used to classify bone status.
In general:
The T-score is helpful for diagnosis, but it is not the whole story.
You can have a low T-score and lower fracture risk than expected. You can also have a less severe T-score but still have high fracture risk because of poor bone quality, prior fractures, medications, or other risk factors.
The Z-score compares your bone density to what is expected for someone your age.
This can be especially helpful in younger people.
If a younger person has a very low Z-score, it may suggest there is something else driving bone loss, such as:
For diagnosis, the T-score is usually the main number. But the Z-score can provide important context.
One of the biggest mistakes people make is comparing scans from different locations or different machines.
DEXA has variability.
If you have one scan done at one imaging center and another scan done somewhere else, the numbers may not compare cleanly.
That can create confusion.
You may think you gained bone when the difference is really due to the machine. Or you may think you lost bone when the difference is just measurement variation.
Whenever possible, repeat your DEXA:
This gives you a much better chance of comparing apples to apples.
DEXA does not change quickly.
It also has a margin of error.
That means a small change on your report may not reflect a true change in bone density.
Many clinics use a concept called least significant change, or LSC. This is the amount of change needed before we can be confident the change is real and not just machine variability.
In practical terms, if your DEXA changes by 1% or 2%, that may not be meaningful.
Depending on the machine and site, it may take a larger change before we can say your bone density truly improved or worsened.
This is why it is risky to panic over tiny changes.
The trend matters. The machine matters. The report quality matters. And the full clinical picture matters.
Most people only look at the numbers on the DEXA report.
But the images matter too.
A trained clinician can look at the actual images and see whether positioning, anatomy, arthritis, rotation, scoliosis, or degenerative changes may be affecting the results.
For example, spine arthritis can sometimes make the spine bone density look better than it really is. Rotation or poor positioning can also influence the measurement.
At the hip, it matters whether the femoral neck region was outlined correctly.
This is one reason you should not rely only on the printed T-score. The image quality and region selection matter.
Many DEXA reports include a FRAX score.
FRAX is a fracture risk calculator. It estimates your 10-year risk of:
FRAX uses bone density along with clinical risk factors.
These may include:
FRAX can be helpful, but it also has limitations. It does not capture every risk factor and may underestimate risk in some people.
Still, it can add context beyond the T-score.
TBS stands for trabecular bone score.
It is an additional analysis that can sometimes be added to a DEXA scan. It uses the DEXA image to estimate aspects of trabecular bone structure.
Trabecular bone is the spongier, inner part of bone. It is especially important in areas like the spine.
TBS is meant to give more information about bone quality.
That matters because bone strength is not just density.
Bone quality includes things like:
DEXA mainly measures density. TBS tries to provide more insight into structure.
TBS can sometimes help explain why two people with the same T-score may have different fracture risks.
For example, someone may have osteopenia on DEXA but degraded bone quality on TBS. That may suggest higher fracture risk than the DEXA alone would indicate.
Or someone may have osteopenia with a normal TBS, which may be more reassuring.
TBS can classify bone quality into categories like:
This can add context to your DEXA.
TBS does not always change what we do.
If someone has osteoporosis or osteopenia and TBS shows partially degraded bone, the plan may still be the same: improve bone health, reduce fracture risk, and address the root causes of bone loss.
TBS can be helpful, but it is not always a game-changer.
In some cases, it reassures us. In other cases, it confirms what we already suspected.
That does not mean it is useless. It simply means it should be interpreted as one piece of the larger picture.
REMS stands for radiofrequency echographic multi-spectrometry.
It is an ultrasound-based technology used to assess bone health.
Unlike DEXA, REMS does not use X-rays. It uses ultrasound to evaluate bone and provide information about bone density and fracture risk.
REMS can measure areas like the:
A REMS report may include:
This makes REMS interesting because it can provide both density and quality-related information.
This is where people get confused.
You cannot directly compare REMS bone mineral density to DEXA bone mineral density.
They are different technologies.
If your DEXA says your spine T-score is -3.0 and your REMS says your spine T-score is -2.0, that does not automatically mean you reversed osteoporosis.
It means the two technologies gave different results.
Both may provide useful information, but they are not interchangeable in that way.
If you want to track change over time, compare:
One of the useful features of REMS is the fragility score.
This score is intended to estimate bone fragility and fracture risk.
In many reports, the fragility score is shown with a visual scale, often moving from green to yellow to red.
Lower is generally better.
This can help provide context beyond the T-score.
For example, a person may have osteopenia on REMS but a low fragility score, which may suggest lower fracture risk than expected.
Or someone may have a concerning fragility score, which may suggest the need for a more aggressive plan.
Some REMS reports show fracture risk in a way that can be confusing.
For example, a report may show a fracture risk number that appears like a percentage, but it may actually represent events per 1,000 people.
That is a big difference.
Four to eight out of 1,000 is not the same as 4% to 8%.
If you are reading a REMS report, make sure you understand exactly how the number is being presented.
This is another reason to review the report with someone who understands the technology.
The answer depends on what you have access to and what you are trying to learn.
If I had access to both DEXA and REMS, I would ideally use both. They provide different pieces of information.
If I had to choose one, REMS may offer more useful information in some cases because it gives both density and fragility-related data.
But DEXA is still the standard, and it is still valuable.
This is a critical point.
Whether you use DEXA or REMS, imaging changes slowly.
If you are using a drug, yearly or every-other-year imaging may be enough in many cases.
But if you are using a lifestyle-based plan, nutrition, exercise, hormones, supplements, and other interventions, you may want feedback sooner than imaging can provide.
That is where bone turnover markers become helpful.
Bone turnover markers are blood or urine tests that help show what is happening with bone metabolism.
Two commonly used markers are:
These markers can change within weeks or months, much faster than imaging.
They can help answer:
Bone turnover markers do not replace imaging. But they can help fill the gap between scans.
A stronger bone health monitoring plan may include:
The goal is not to collect random data.
The goal is to make better decisions.
If imaging is stable but bone turnover markers are moving in the wrong direction, you may need to intervene sooner. If markers look good but imaging has not changed yet, that may give you confidence to continue the plan.
DEXA, TBS, and REMS are all tools.
DEXA helps diagnose osteoporosis and track bone mineral density over time. TBS adds information about trabecular bone quality. REMS uses ultrasound to provide bone density and fragility-related information.
None of them are perfect.
Small DEXA changes may not be meaningful. TBS may not always change your plan. REMS should not be directly compared to DEXA as if they are the same test.
The best approach is to understand what each test is telling you, repeat tests consistently, and use imaging alongside bone turnover markers and your full clinical picture.
Because the goal is not just a better report.
The goal is stronger bones, lower fracture risk, and better health span.
If you are confused by your DEXA, TBS, or REMS results, you are not alone. Most people are handed a report with very little explanation and then told to make big decisions based on numbers they do not fully understand.
That is exactly why education matters.
Inside The OsteoCollective, we help members understand the bigger picture of bone health, including imaging, lab markers, exercise, nutrition, hormones, and long-term fracture prevention.
Because osteoporosis is not the end. But deciding to reverse it is the beginning.
This content is for educational purposes only and is not medical advice. Bone imaging results should be interpreted by a qualified healthcare professional who understands your medical history, fracture risk, medications, imaging quality, and treatment goals. Do not start, stop, or change medications, supplements, or exercise plans based only on imaging results without medical guidance.

Your Blueprint for Lasting Bone Health and Longevity

.svg)
.svg)
.svg)
.svg)


Join us LIVE October 29th, 2026 at 300pm EST to Learn Dr. Doug's proven framework for Osteoporosis Reversal for FREE. Yes! Reversing Osteoporosis is possible and has happened for hundreds of Dr. Doug's patients.
If you have been blind-sided, feel stuck, confused, and exhausted with your diagnosis, this Masterclass is for you!

.svg)

.svg)
